Analog Chorus,
Digitally Reconstructed.
Reverse engineering and DSP modeling of the BOSS CE-2 chorus pedal – from circuit analysis and measurement to an AU/VST3 audio plugin.
Bachelor Thesis · Audiovisual Media · 2025
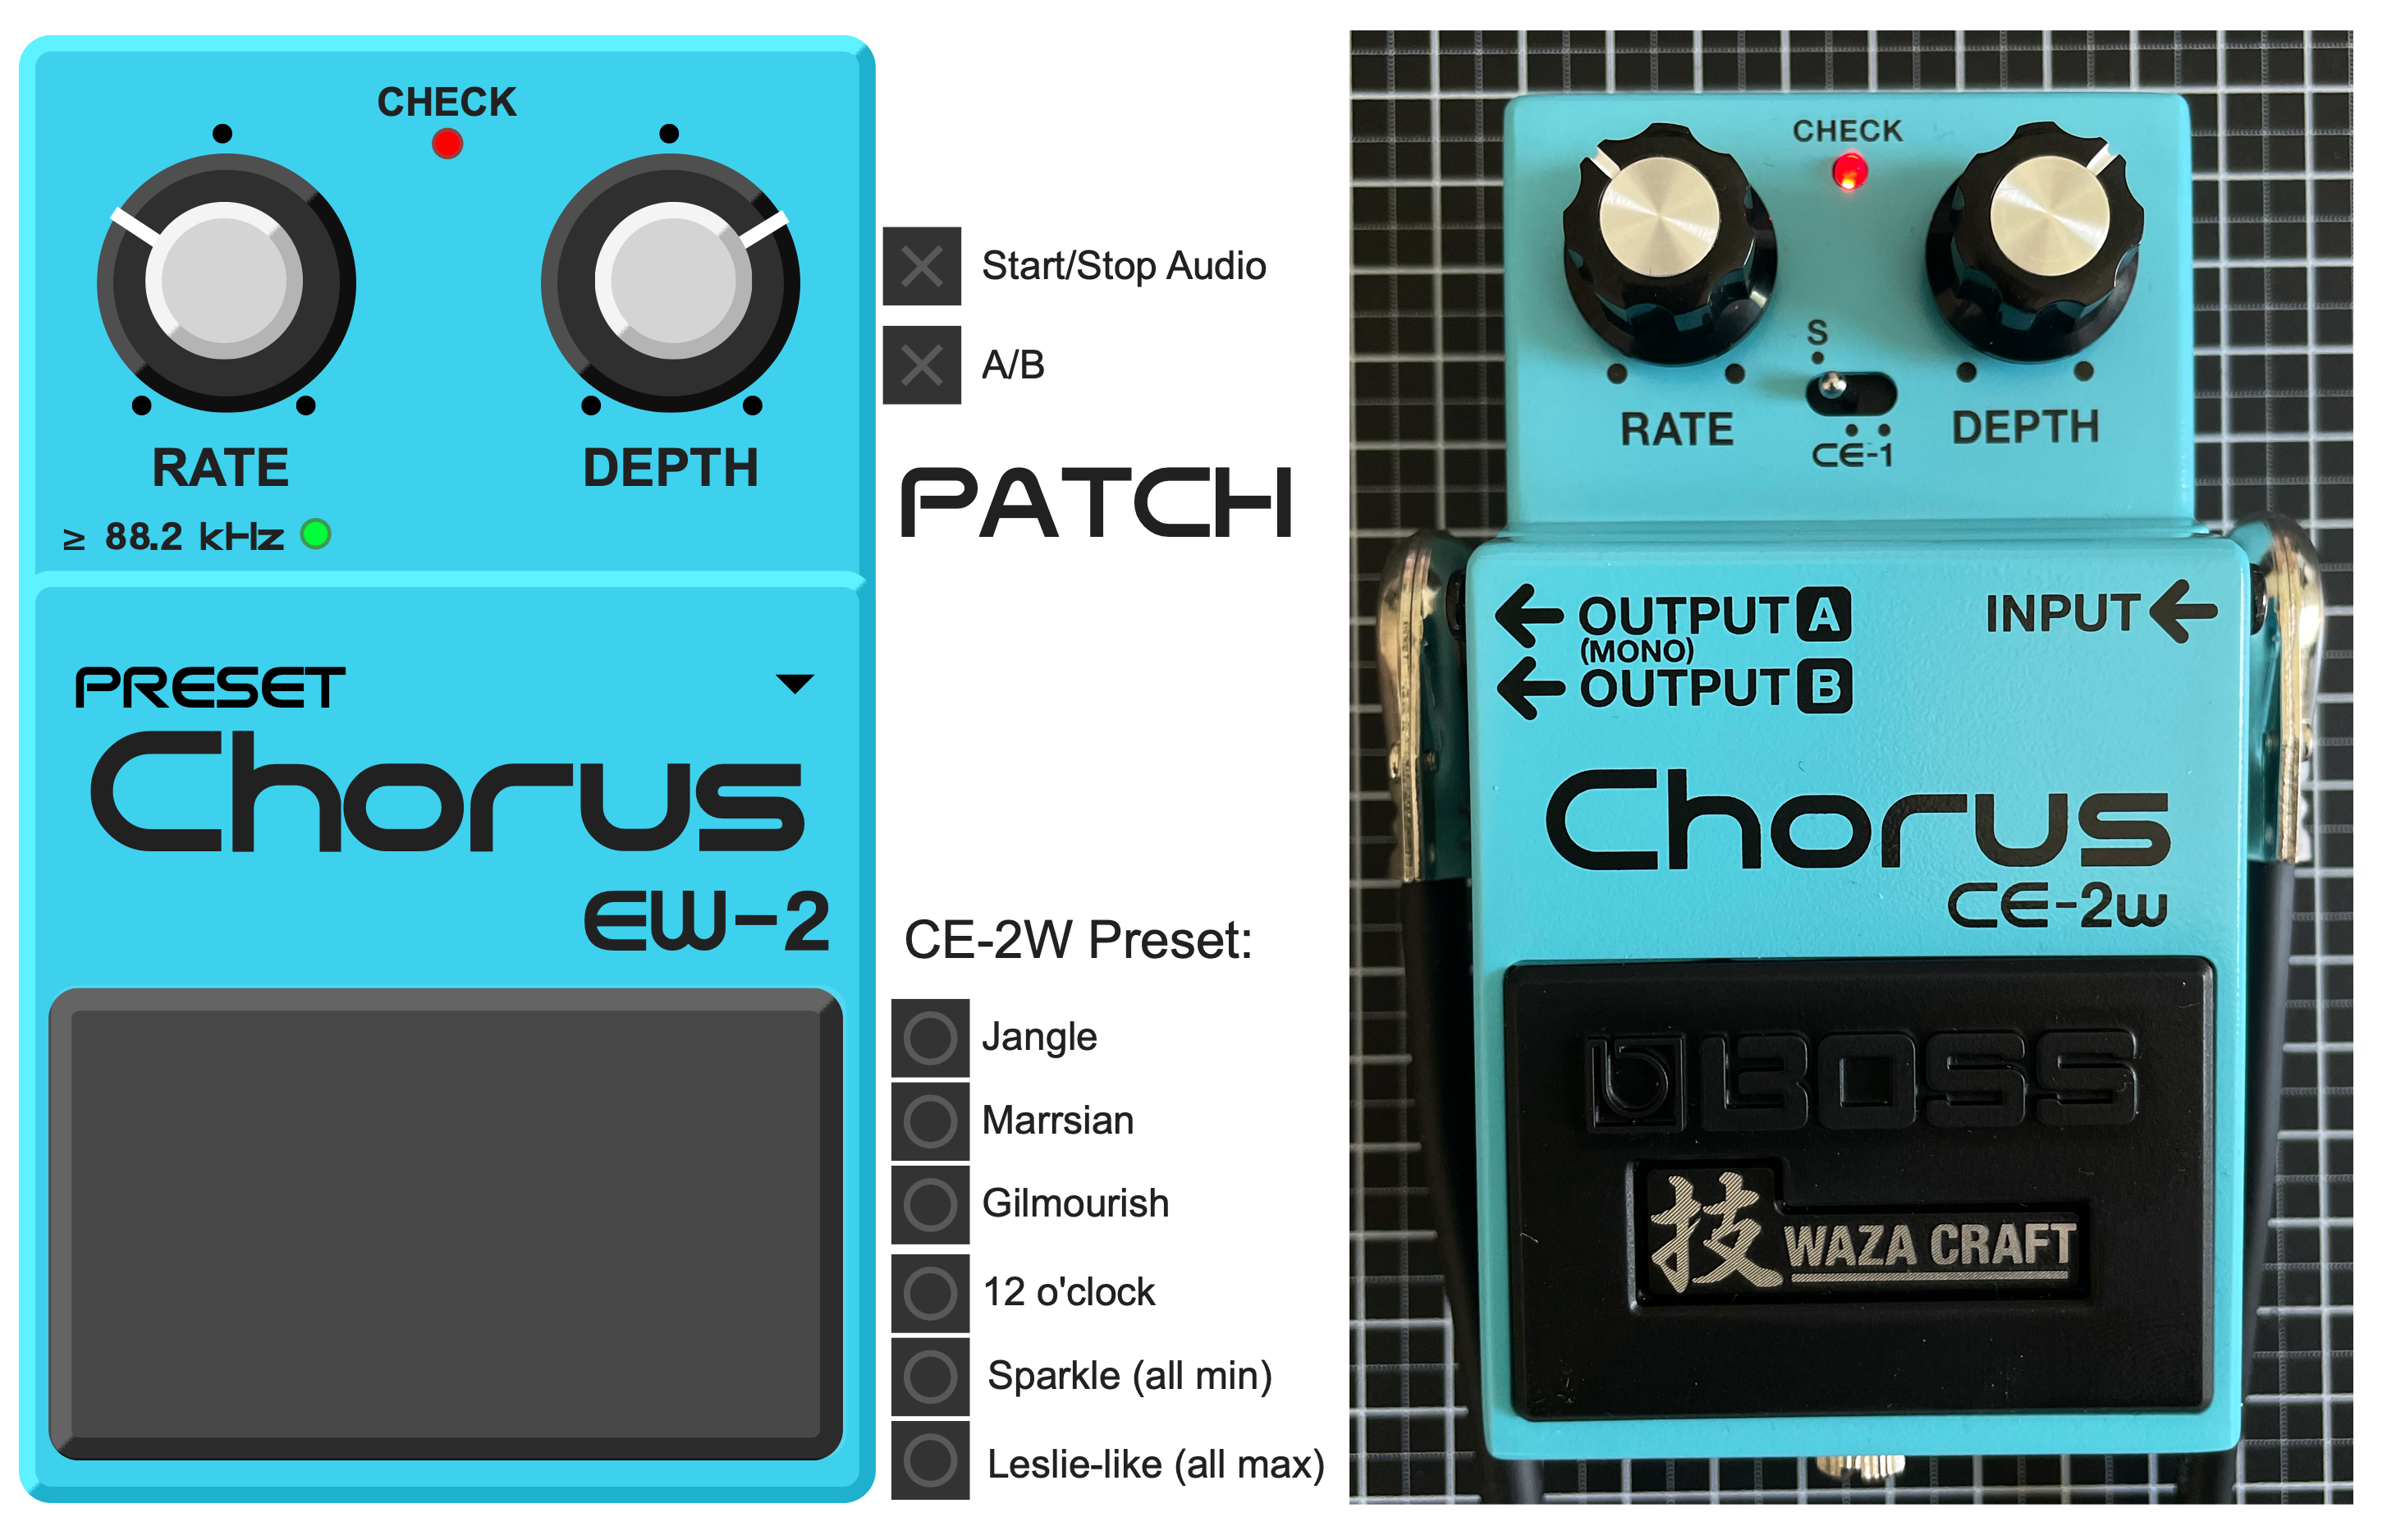
Reverse engineering and DSP modeling of the BOSS CE-2 chorus pedal – from circuit analysis and measurement to an AU/VST3 audio plugin.
Bachelor Thesis · Audiovisual Media · 2025
01 – Project Overview
The project analyzes the signal processing of the BOSS CE-2 and translates its characteristic chorus behavior into a modular DSP model. Circuit analysis, measurement and digital reconstruction were combined in Max/RNBO and exported as an AU/VST3 plugin.
02 – Analog to Digital
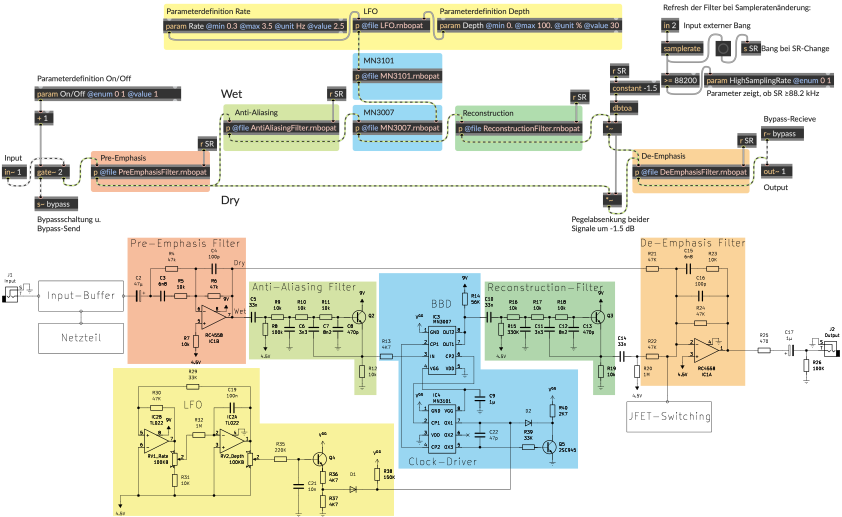
Rather than recreating the effect as a black box, the CE-2 circuit was broken down into its functional building blocks. Each signal-processing stage was analyzed individually and translated into a corresponding digital module in RNBO.
Functional block diagram of the CE-2 signal path:

Analog circuit stages and their corresponding RNBO-implementation:
03 – Circuit Simulation
The analog filter stages were recreated and simulated in KiCad to derive validated frequency responses for the digital model. The Pre-Emphasis stage serves as an example of how the analog circuit was translated into four sample-rate-aware digital filters.
Analog Circuit
Simulated Response
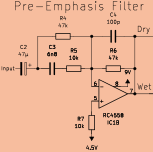
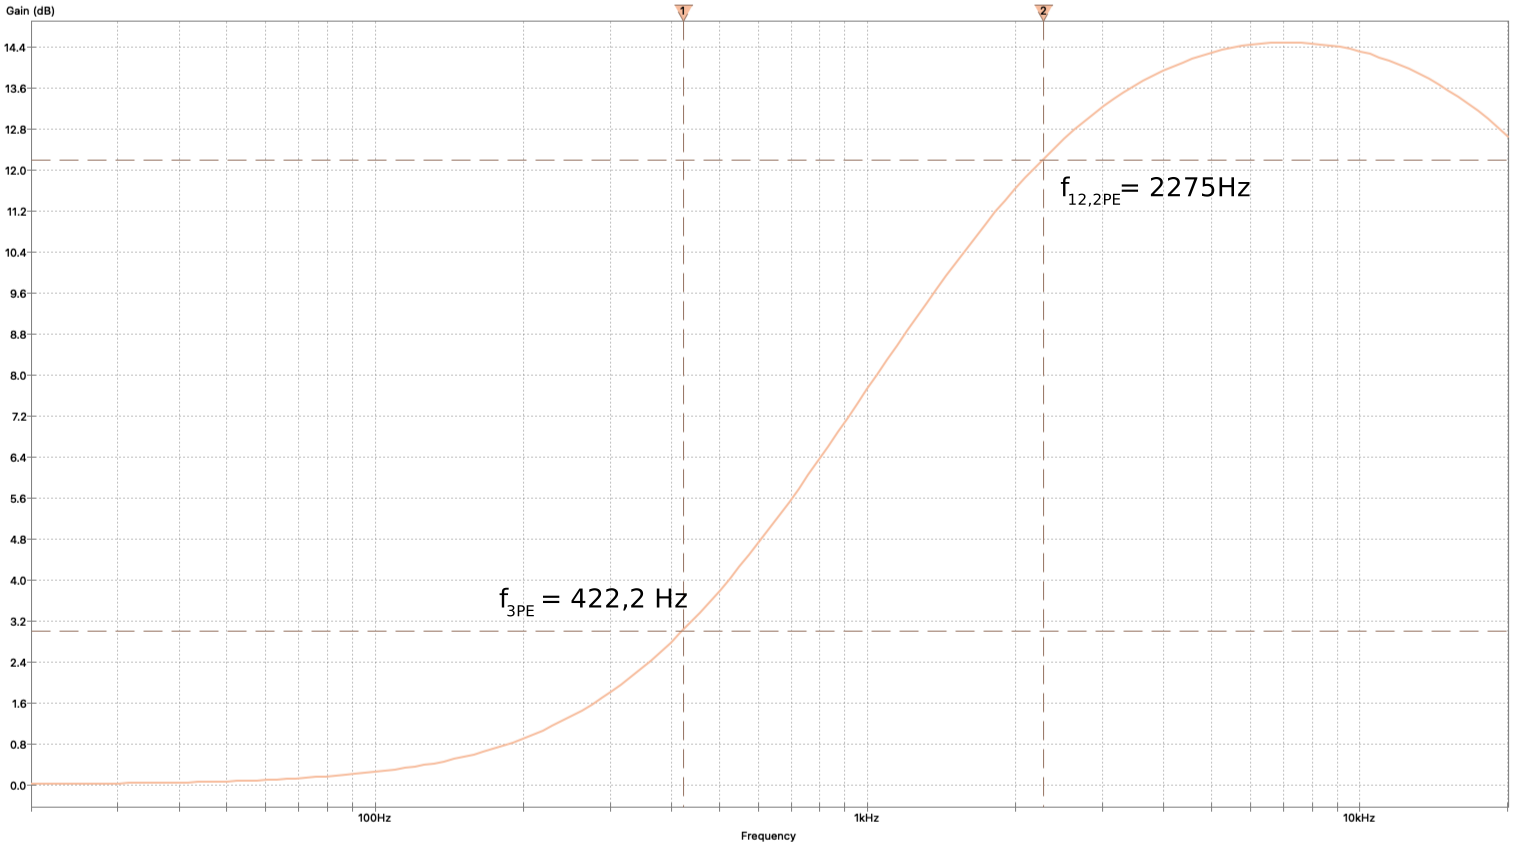
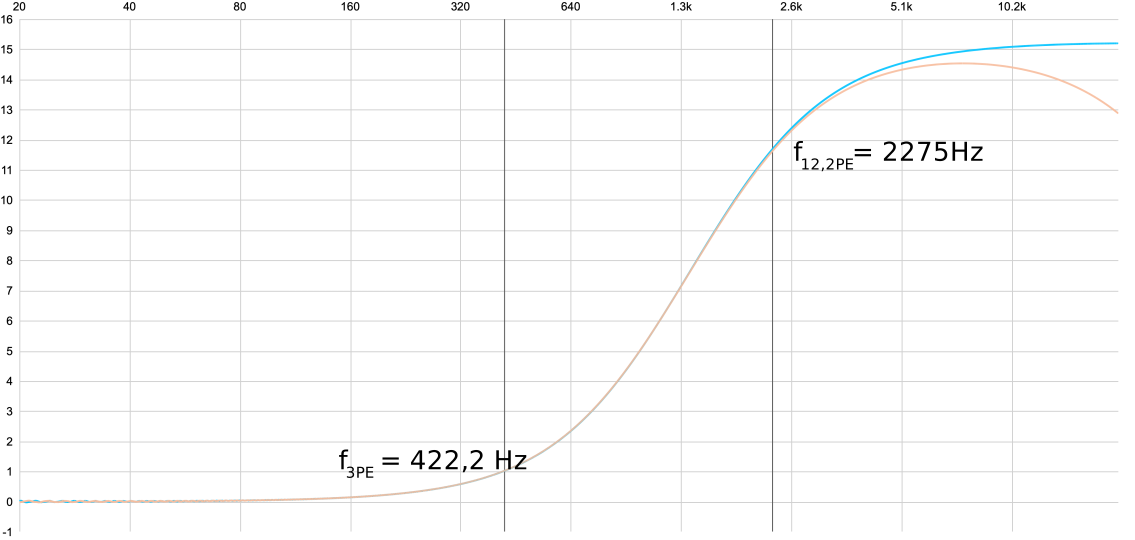
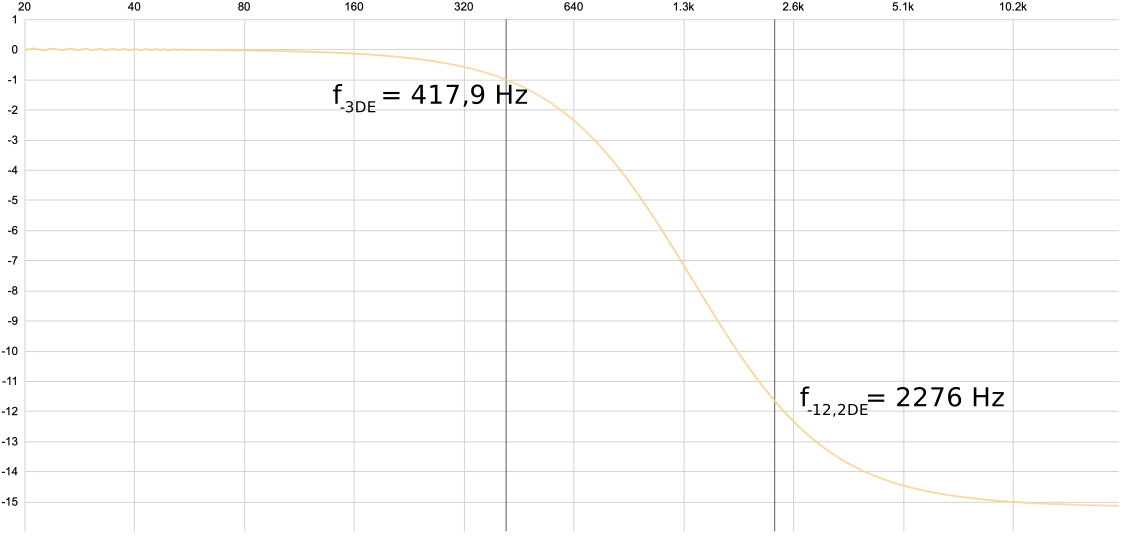
Although the circuit initially resembles a shelving filter, simulation revealed an additional high-frequency roll-off caused by C4 and R6 in the op-amp feedback path. The digital model therefore combines a shelving filter with a second-order low-pass to more closely reproduce the simulated analog response.
The analog roll-off extends beyond the Nyquist frequency at common sample rates such as 44.1 and 48 kHz. To emulate the Pre-Emphasis response as precisely as possible at each sample rate while remaining aliasing-free, the RNBO implementation automatically selects the appropriate filter structure and recalculates its coefficients whenever the host sample rate changes.
≥ 88.2 kHz-Patch
44.1 / 48 kHz-Patch
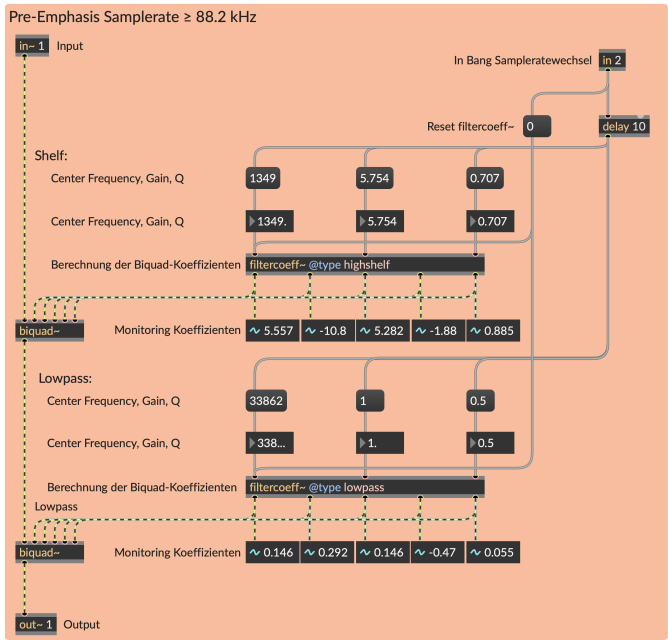
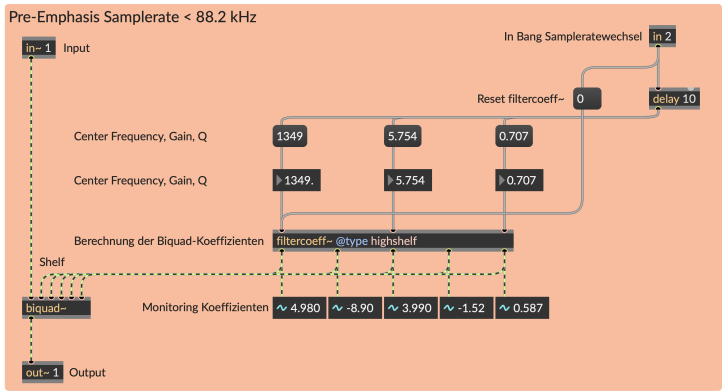
Responses of the "≥ 88.2 kHz-Patch" (orange) and the "44.1 / 48 kHz-Patch" (blue)
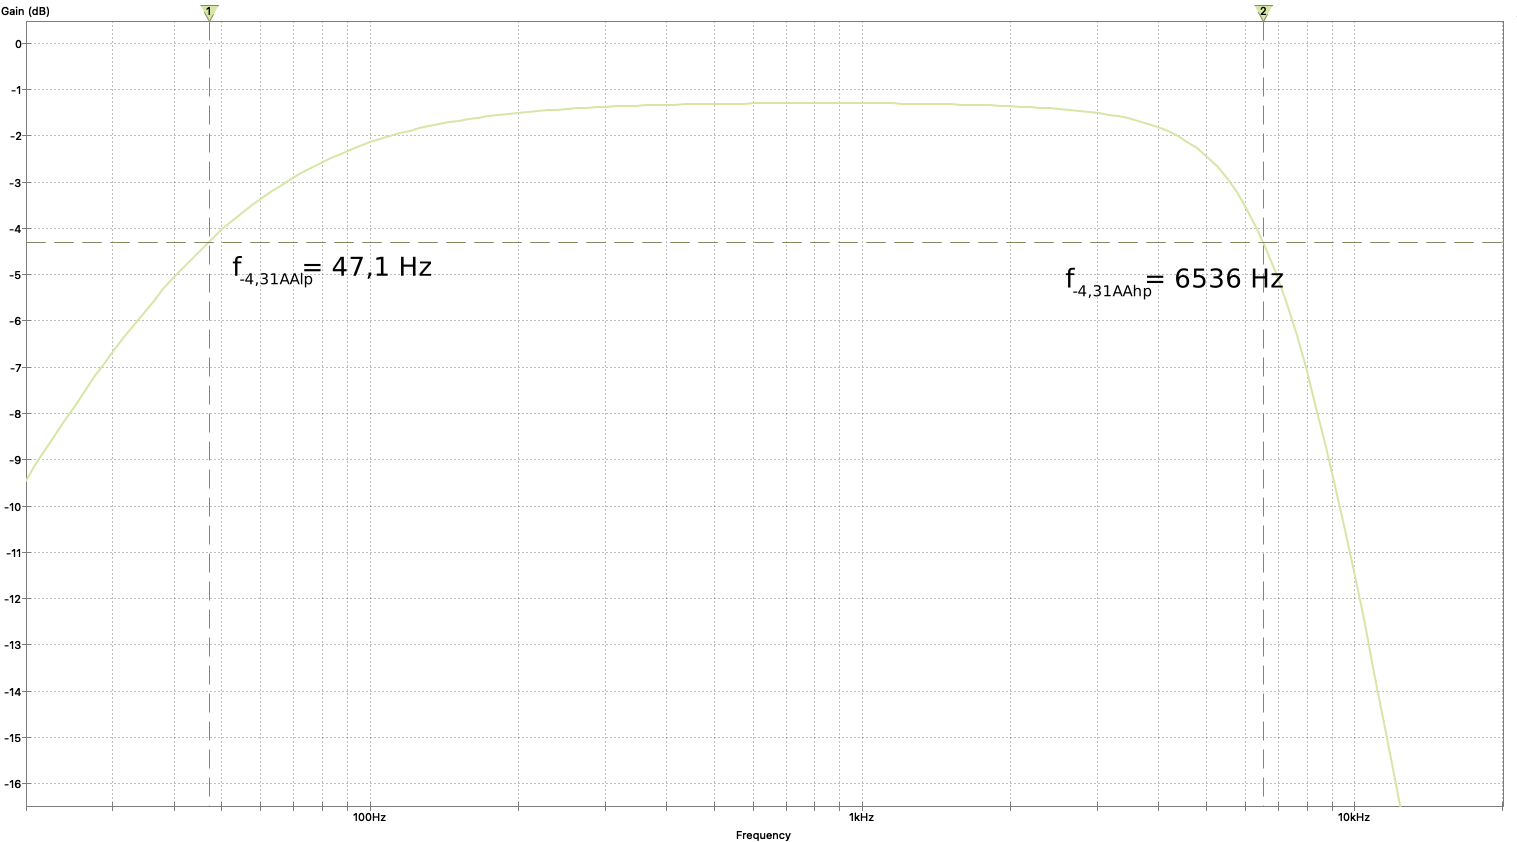
The remaining filter stages were implemented using the same simulation-based approach. Their digital responses closely reproduce the frequency characteristics derived from the analog circuit simulations.
Circuit Simulation
Digital Model
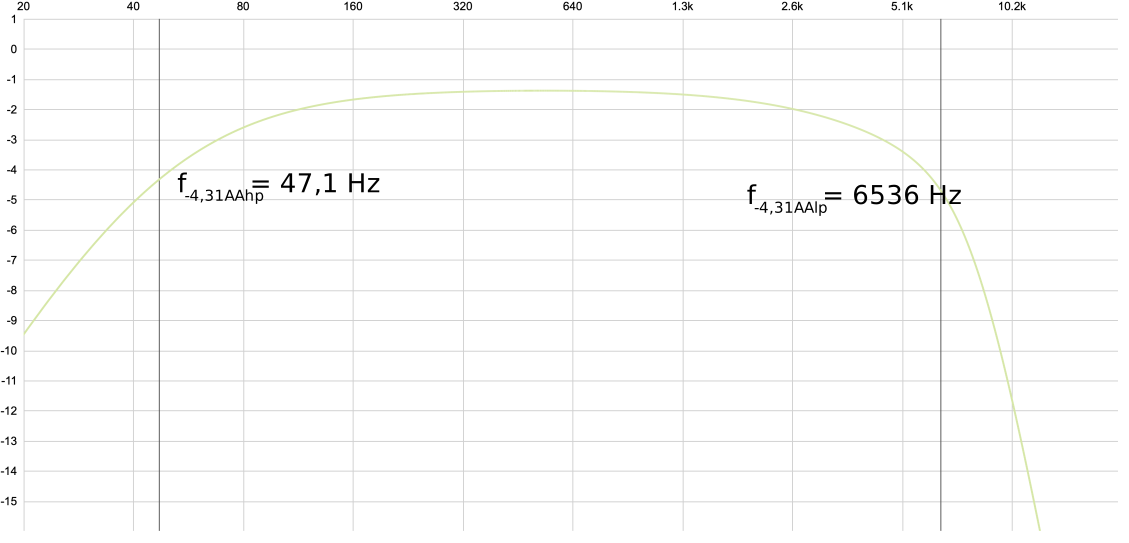
Circuit Simulation
Digital Model
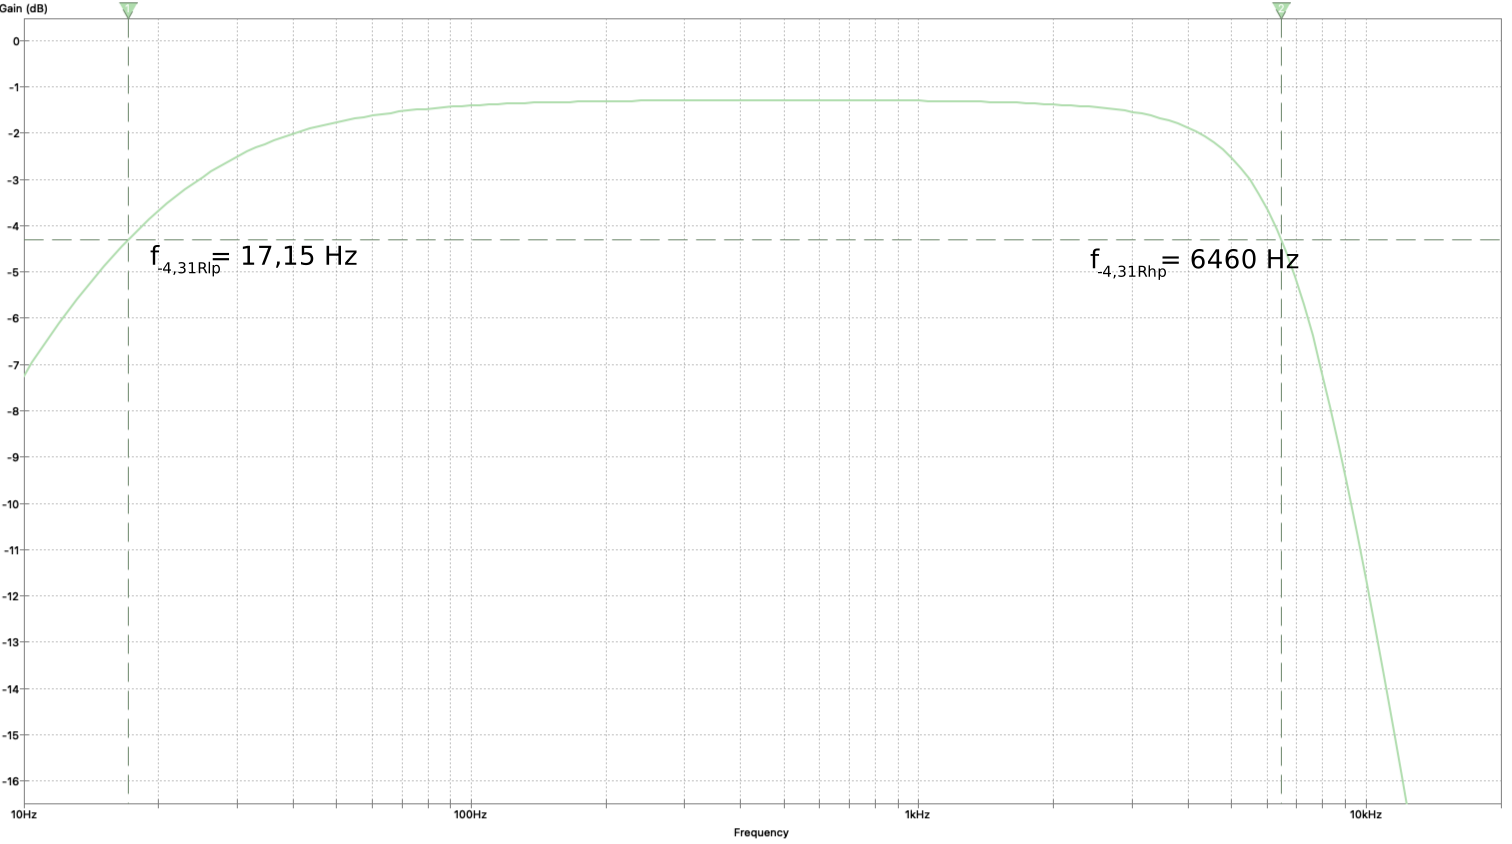
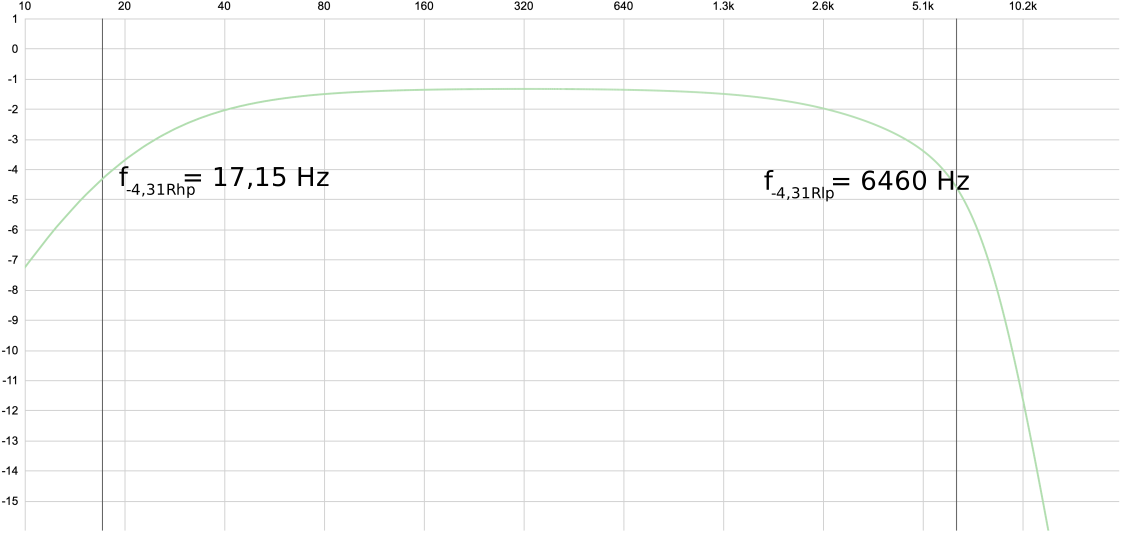
Circuit Simulation
Digital Model
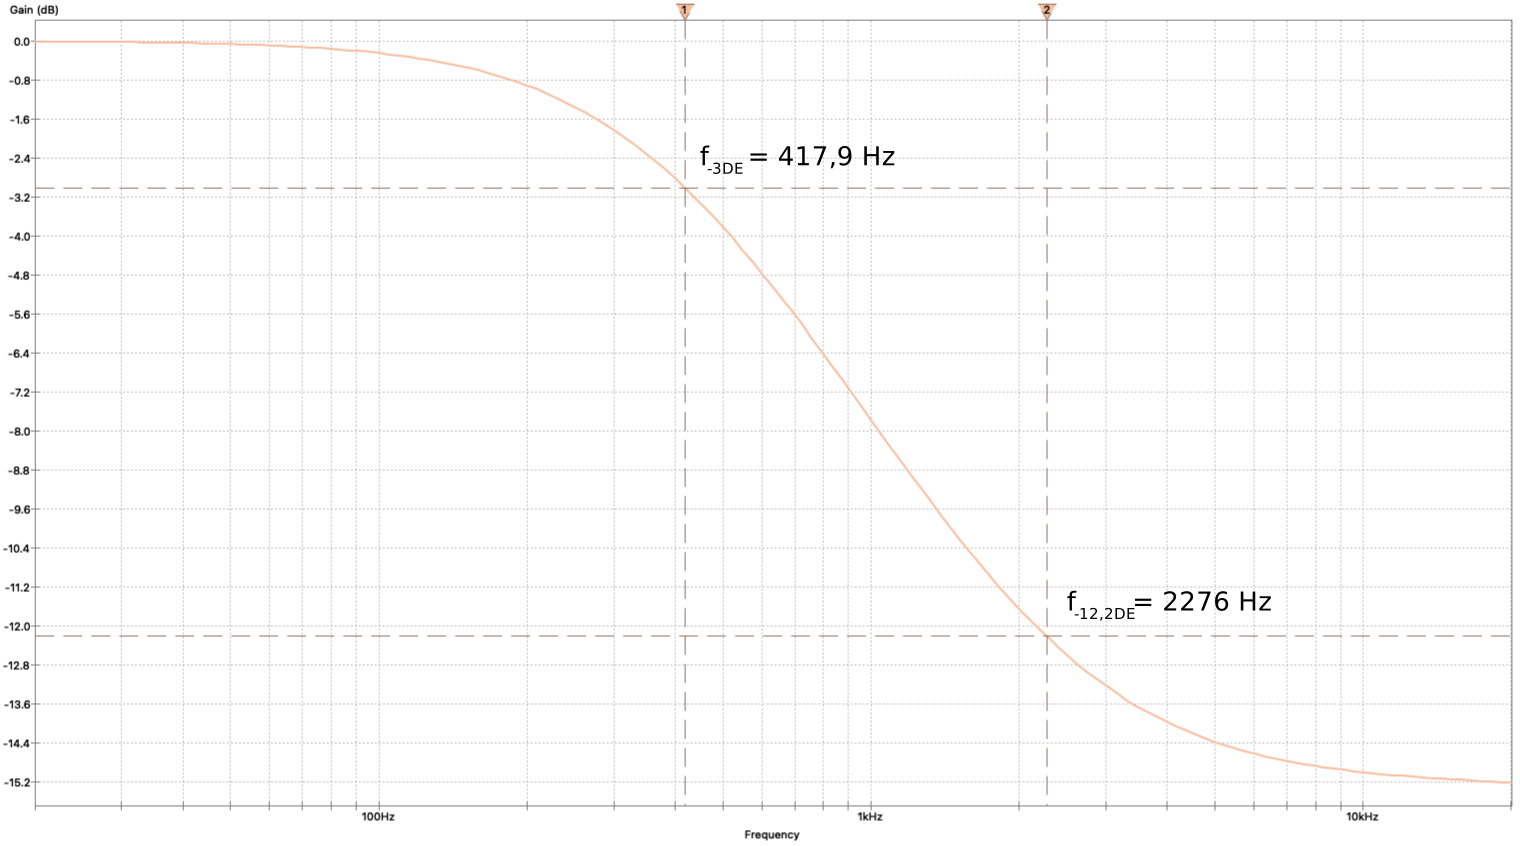
04 – Measurement
While the filter stages could be derived from circuit analysis and simulation, the CE-2’s actual modulation behavior was determined experimentally. A dedicated measurement setup was used to derive the delay range and LFO rate directly from the hardware.

A periodic impulse signal was sent through a reamping box into a CE-2W. In stereo mode, the pedal outputs the processed wet signal and the unprocessed dry signal separately. The instantaneous delay was then determined from the sample offset between corresponding impulses in both recordings.
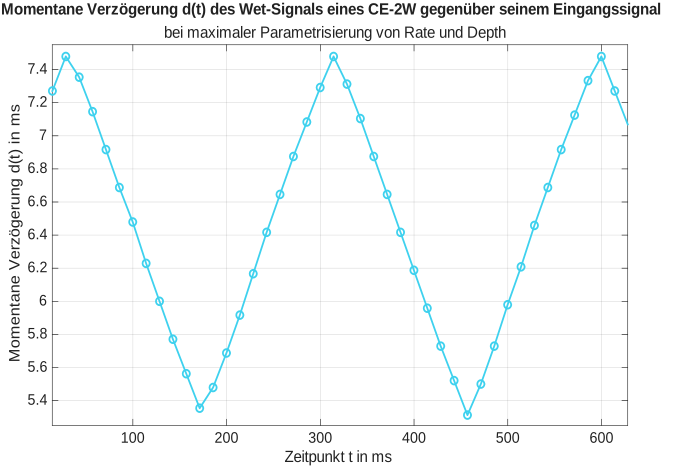
Repeating the measurement across multiple LFO cycles reveals the time-varying delay produced by the BBD. Its extrema and period were used to derive the modulation depth, LFO rate and the pedal’s base delay.
Notably, the measured base delay of 6.41 ms is shorter than commonly associated with chorus effects, indicating that the characteristic sound of the CE-2 depends on more than delay time alone.
05 – Digital DElay Structure
At the core of the CE-2, the MN3101 clock generator controls the delay produced by the 1024-stage MN3007 bucket-brigade device. In the digital model, this clock-driven structure is reduced to its signal-processing function: a continuously modulated delay line controlled by the measured behavior of the original pedal.
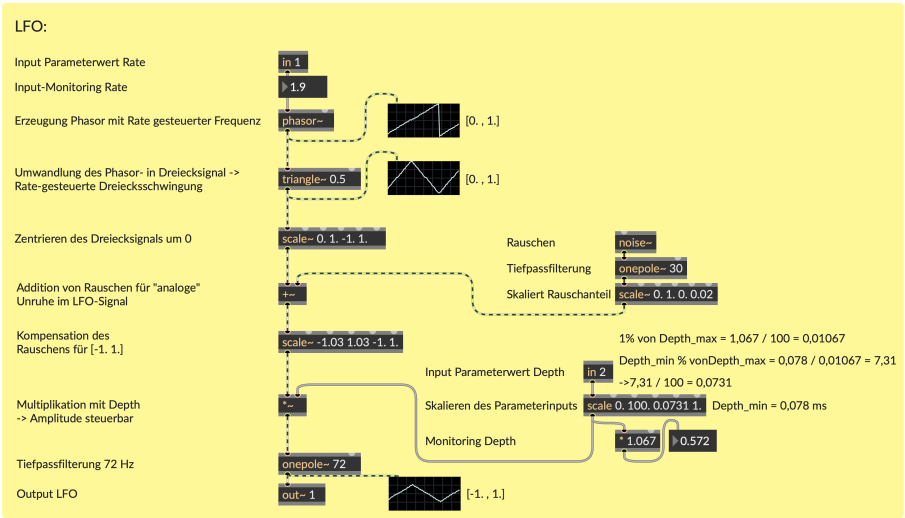
A triangular LFO recreates the modulation behavior measured from the hardware. Rate controls its frequency, while Depth scales the modulation range. Filtered noise is added to introduce subtle irregularities into the otherwise ideal waveform.
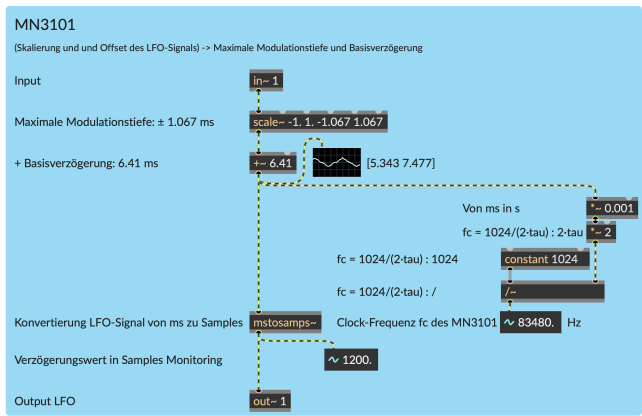
In the analog CE-2, the MN3101 converts the LFO voltage into the clock signal driving the BBD. In the digital model, the measured modulation range and base delay are used directly to derive the instantaneous delay time. The corresponding BBD clock frequency is retained as a derived quantity rather than serving as the mechanism that physically clocks the delay line.
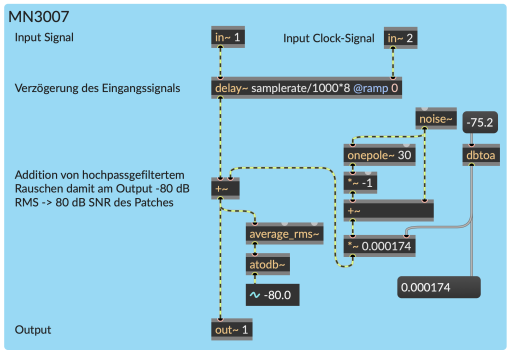
The MN3007’s 1024-stage bucket-brigade structure is replaced by a variable digital delay line controlled by the preceding modulation stage. Rather than simulating each individual BBD stage, the model reproduces its time-varying delay behavior directly. Filtered noise is added at the output to approximate the measured noise floor of the analog device.
06 – Plugin Export
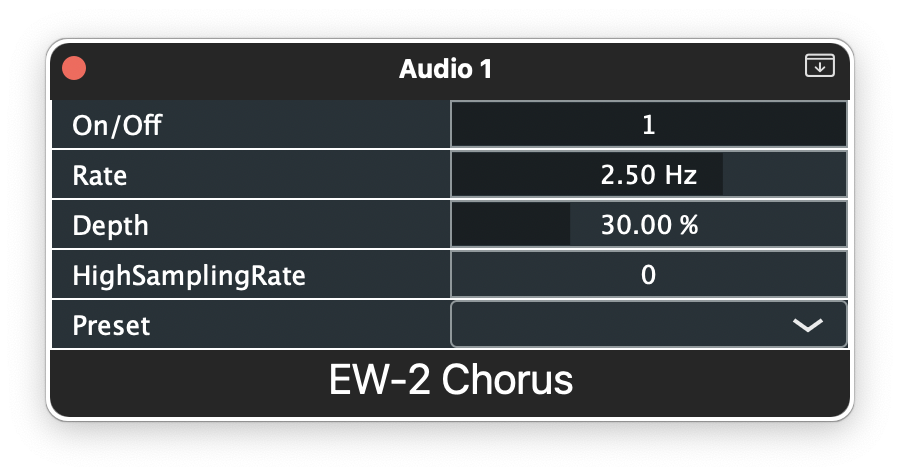
The completed RNBO model was exported as C++ source code and compiled as AU and VST3 plugins using Cycling ’74’s RNBO JUCE template. This made the reconstruction usable directly inside a DAW, with Rate, Depth and bypass exposed as automatable host parameters and the reconstructed CE-2 settings available as presets.
AU version of the model running in Logic Pro.
07 – Validation
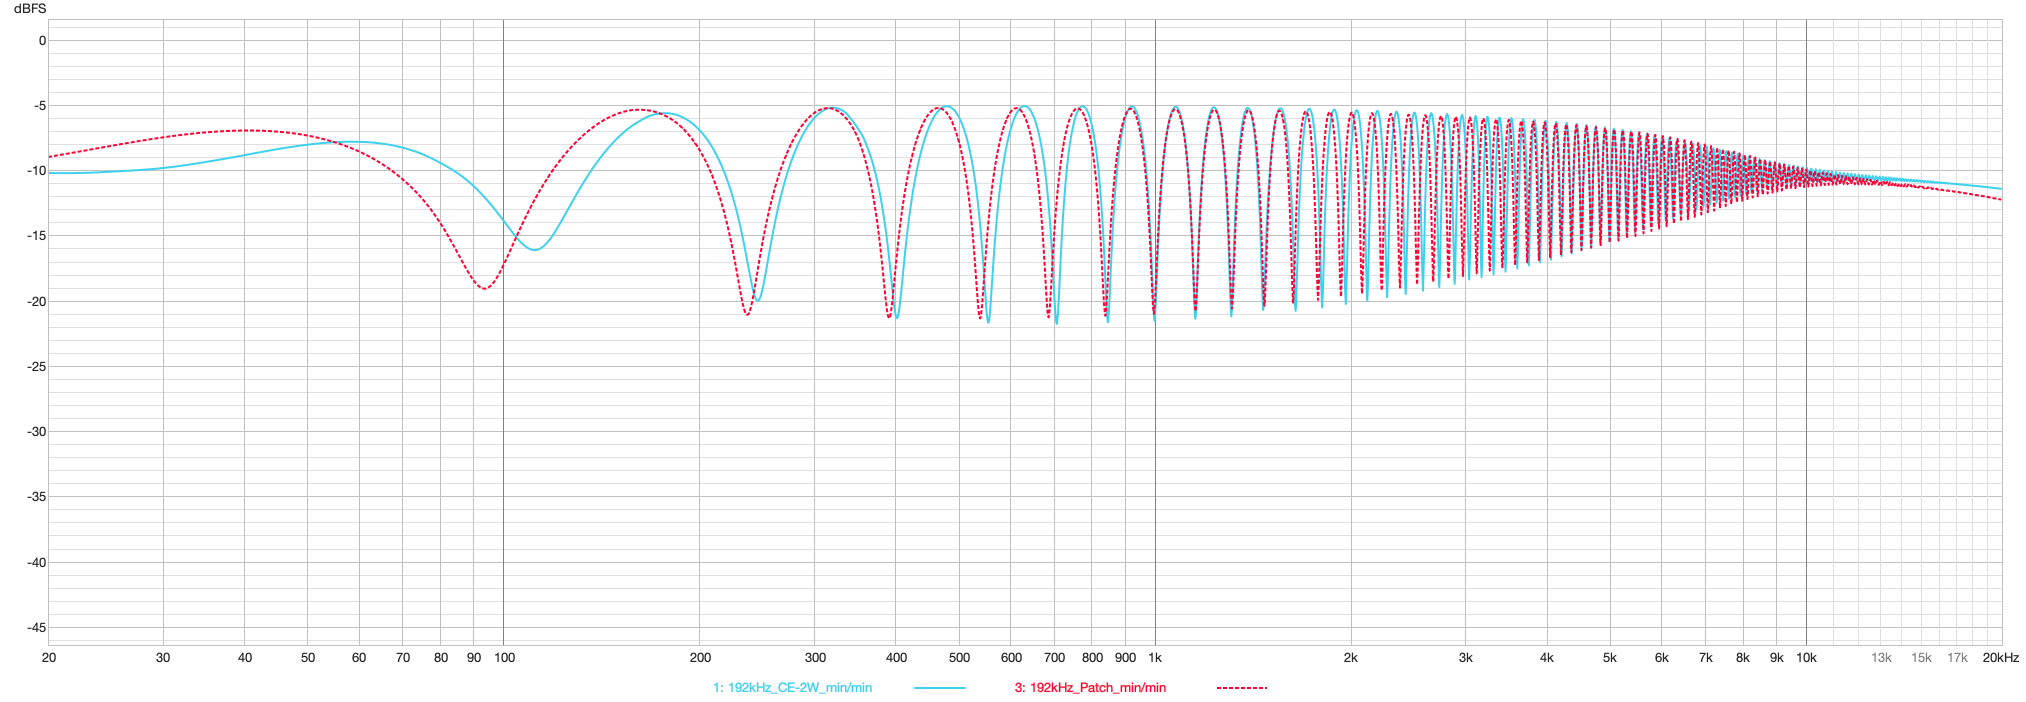
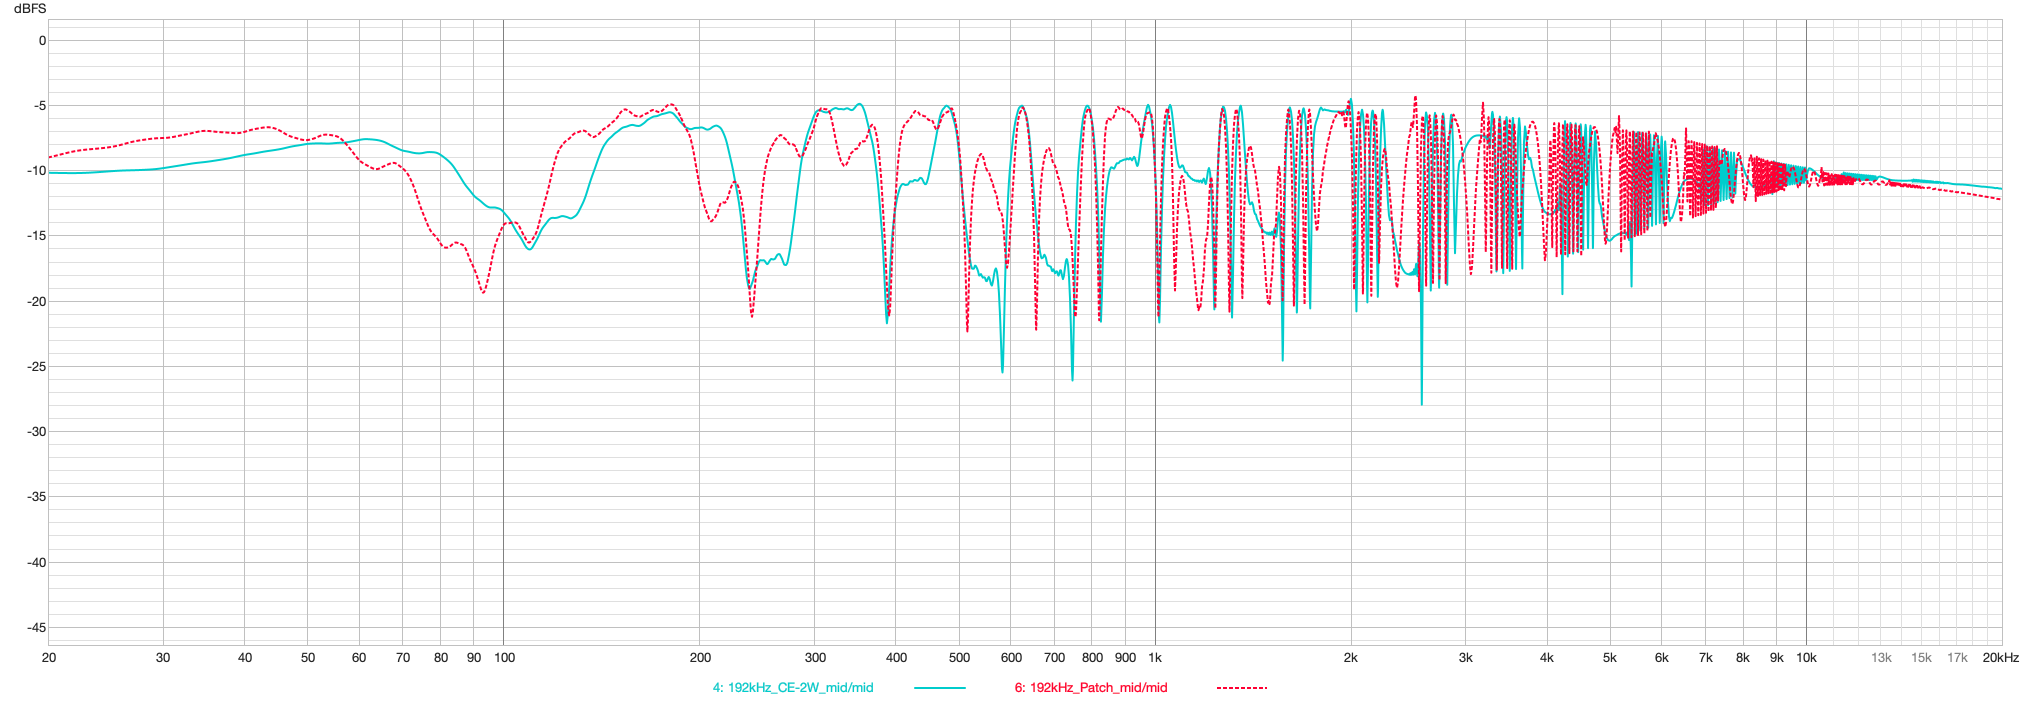
The completed model was validated against measurements of the CE-2W at three representative parameter settings. Frequency responses were compared under matching conditions to evaluate how closely the digital implementation reproduces the behavior of the analog hardware.
Minimum Settings
Mid Settings
Maximum Settings
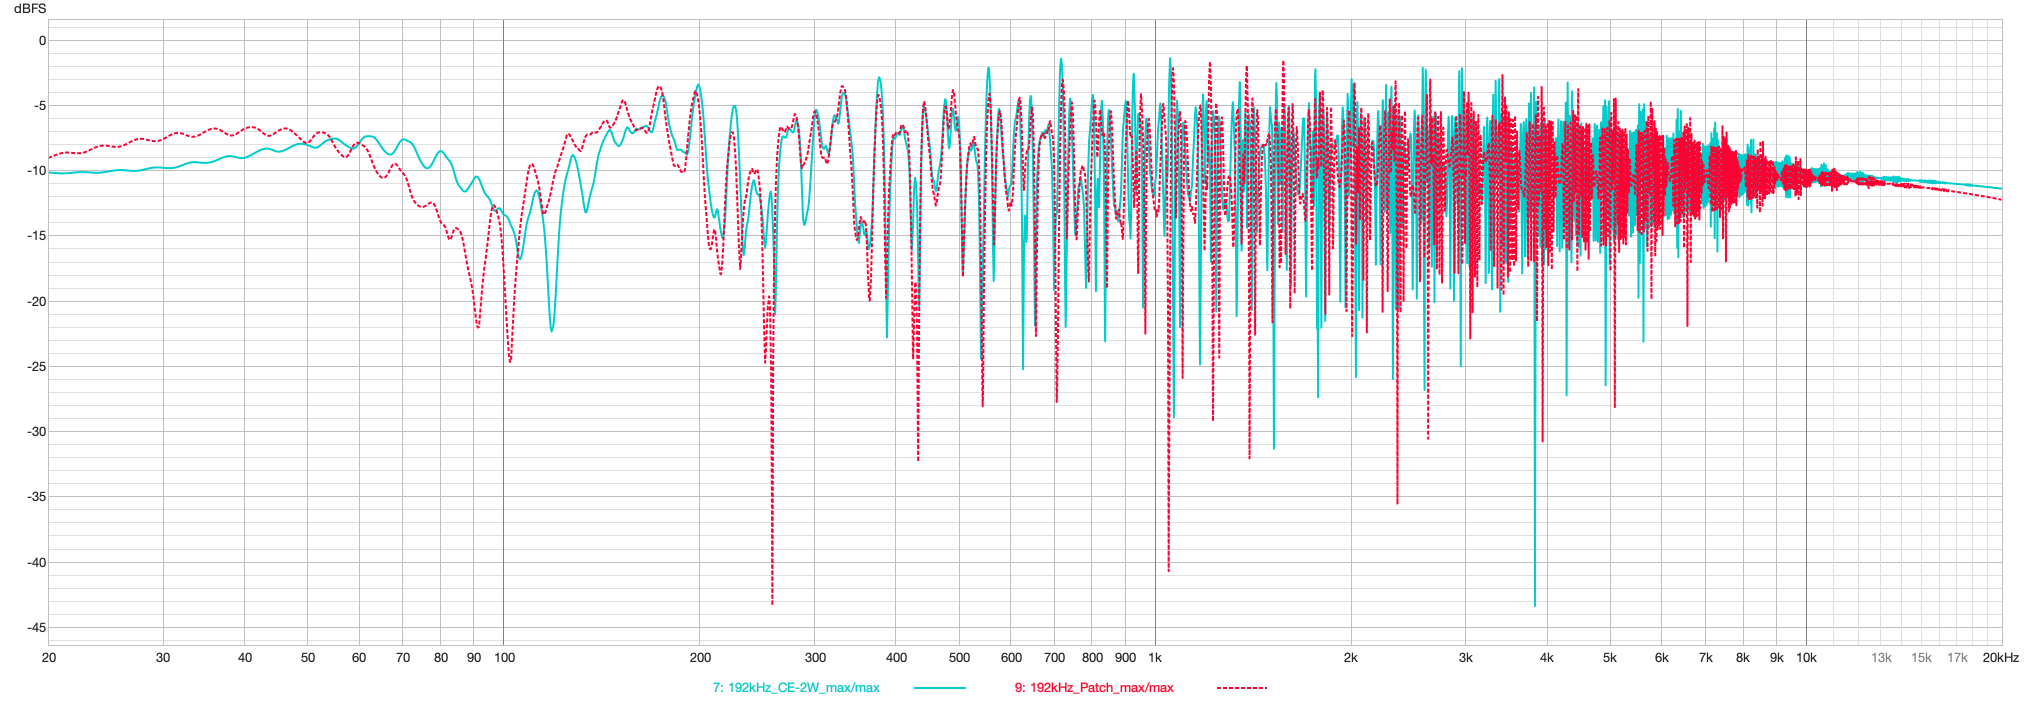
Result:
The model reproduces the CE-2W's characteristic frequency-dependent comb-filter structure across the tested parameter range. Remaining deviations primarily concern individual notch positions, phase behavior and nonlinear distortion.
Further Validation
Beyond the frequency-response comparison shown here, the full evaluation also covered phase response, nonlinear distortion (THD), and operation at 44.1 kHz.
08 – Listen
The final RNBO model runs directly in the browser. Explore six reconstructed CE-2W settings, adjust Rate and Depth, and compare the model directly with the dry signal and the original hardware recordings.
09 – Documentation
This project was developed as my Bachelor’s thesis in Audiovisual Media at Hochschule der Medien Stuttgart. The full thesis, including circuit analysis, DSP implementation and evaluation, is available upon request.
Max / RNBO · KiCad · MATLAB · JUCE · C++ · AU/VST3
Eric Weimann
Engineer for Audiovisual Media